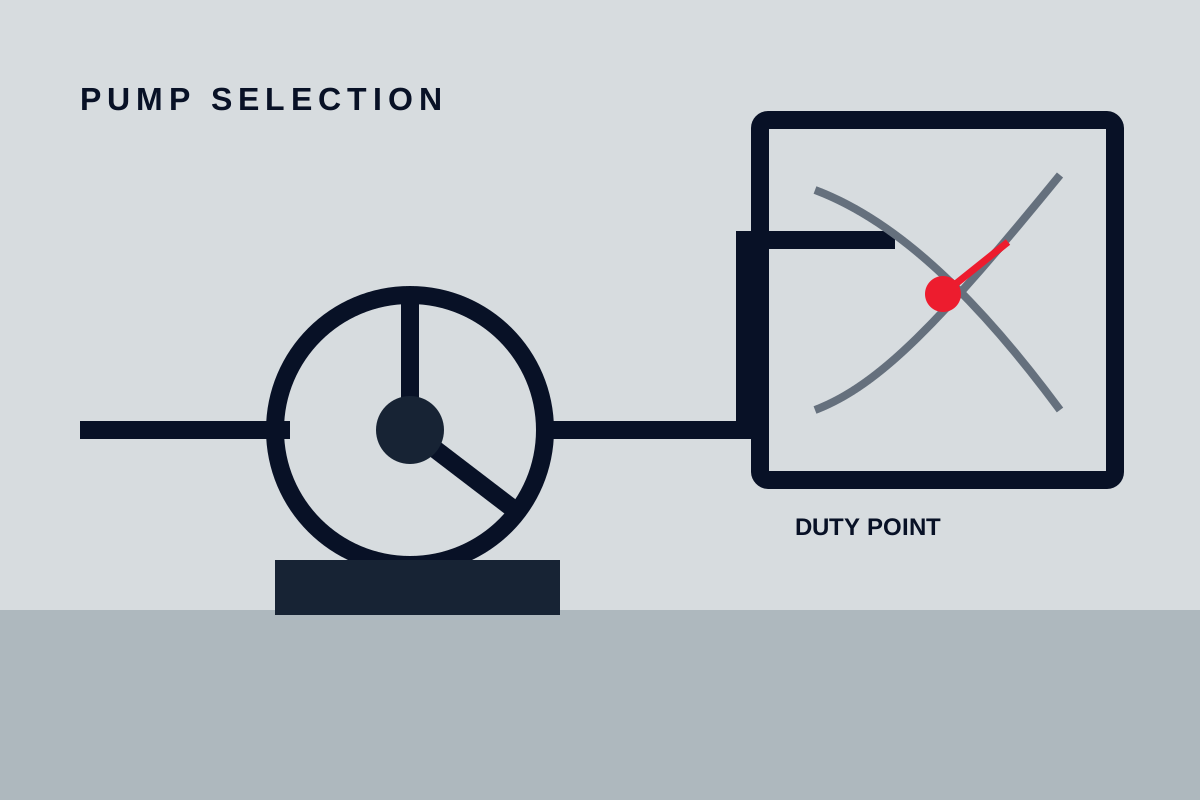


A centrifugal pump should be selected against the system it will serve, not against a single stated flow and head value alone. The practical selection question is whether the pump performance curve and the system curve intersect at an acceptable operating point for every credible operating case—not only at normal production conditions.
For a fixed-speed centrifugal pump, the operating point is generally where the pump head-flow curve intersects the system head curve. That intersection must then be checked against the pump’s documented efficiency, power, net positive suction head required (NPSHR), minimum-flow, maximum-flow, and other manufacturer-specific operating limits. A curve intersection can be hydraulically possible while still being unsuitable for reliable service.
Define the duty cases before reading a pump curve
A pump curve is only useful when the required duty has been defined with enough detail to model the system. Start by separating the normal duty point from the full operating envelope. A pump that works at nominal throughput may be unsuitable during startup, reduced production, line flushing, recycle operation, or an upset condition.
Collect the following inputs before comparing pumps:
- Required minimum, normal, and maximum flow rates.
- Required differential head or pressure at each flow condition.
- Suction vessel level, suction pressure, and discharge destination pressure.
- Static elevation difference between the relevant suction and discharge reference points.
- Pipe sizes, lengths, materials, roughness assumptions, fittings, branch lines, and isolation arrangements.
- Pressure losses through filters, strainers, heat exchangers, meters, control valves, nozzles, and process equipment.
- Liquid density, viscosity, vapor pressure, temperature, solids content, entrained gas, and any expected variation.
- Pump speed, motor rating, control method, standby arrangement, and minimum-flow protection arrangement.
Use current project documents rather than assumptions wherever possible: process flow diagrams, piping and instrumentation diagrams, line lists, equipment datasheets, plot plans, elevation drawings, and control narratives. Vendor pressure-drop data should be used for installed equipment such as filters and heat exchangers when that information is available for the actual configuration.
The Hydraulic Institute’s overview of combined pump and system curves emphasizes that pump-system interaction should be reviewed over a range of conditions. This matters because valve positions, equipment being placed in or out of service, and changes in process conditions can shift the system curve and therefore the actual operating point.
A useful duty-case register might include normal operation, maximum throughput, minimum stable process flow, startup, blocked or restricted downstream paths where applicable, and each pump combination expected in parallel operation. Do not add unrealistic cases merely to make a pump appear unsuitable; equally, do not omit credible conditions because they complicate selection.
Build the system curve from static head and flow-dependent losses
The system curve describes the total head the system requires at different flow rates. It is not a property of the pump. It is a representation of the piping network, elevation changes, process pressure requirements, and flow resistance that the pump must overcome.
Conceptually, total system head can be expressed as:
Total system head = static head + dynamic head losses
Static head is the flow-independent portion of the requirement. It commonly includes the difference in liquid elevation between source and destination, plus any difference in pressure between suction and discharge vessels. If a pump transfers liquid from one open tank to another at a higher elevation, the elevation difference contributes static head even at zero flow.
Dynamic head is the flow-dependent portion. It includes friction in straight pipe and losses through fittings, valves, strainers, instruments, process equipment, and discharge devices. For many turbulent-flow piping systems, these losses rise approximately with the square of flow. The exact relationship depends on pipe geometry, flow regime, liquid viscosity, valve position, and the loss model used.
The Hydraulic Institute’s system-curve guidance distinguishes static head from dynamic or friction-dependent head and explains why the system head requirement changes with flow. A system curve with substantial static head is relatively flatter than one dominated by pipe friction. That shape affects how much flow changes when pump head, speed, or system resistance changes.
For each modeled flow point, calculate or obtain:
- Static elevation and pressure head.
- Straight-pipe friction loss.
- Fitting and valve losses for the expected valve positions.
- Equipment pressure drop at that flow rate.
- Any required pressure at the delivery point.
The calculation method must match the service and project design basis. Do not apply a loss coefficient for a fully open valve if the operating control strategy normally leaves it partially closed. Do not use clean-water filter loss for a filter expected to foul in service without defining the applicable clean and dirty conditions.
For complex networks, a single quadratic curve may be inadequate. Branching lines, changing tank levels, bypasses, parallel paths, control valves, and equipment that cycles on and off can create multiple system configurations. In these cases, create separate system curves or a network model for each defined operating state. The AIChE discussion of pump-network analysis is useful context for why network behavior and incorrect assumptions can produce misleading results.
Overlay the correct pump curve and locate the operating point
A pump performance curve shows the head generated by a specific pump configuration over a range of flow rates at a stated speed. It commonly also shows efficiency, input power, and NPSHR versus flow. The Hydraulic Institute’s pump-curve reference notes that these curves apply to a particular pump model and operating speed, and that liquid viscosity can affect head, flow, efficiency, NPSHR, and power.
Overlay the system curve on the manufacturer’s curve for the exact proposed configuration. Confirm all of the following before relying on the plot:
- Pump model and hydraulic size.
- Impeller diameter or trim.
- Rotational speed.
- Number of stages, where relevant.
- Liquid specific gravity and viscosity basis.
- Motor frequency and variable-speed-drive limits, if applicable.
- Curve test standard and stated tolerance, where supplied.
The intersection of the pump head-flow curve and system curve is the predicted operating point for that pump and system condition. If the system requires more head than the pump can generate at the required flow, the actual flow will settle at a lower value or may be zero if the pump cannot overcome static head. If the system offers less resistance than expected, the pump may run farther right on its curve at a higher flow than the nominal duty point.
Do not use a generic product-family curve as proof of final performance. A family chart may be suitable for early screening, but final selection should use the manufacturer curve and datasheet for the offered pump, impeller, speed, and liquid conditions. This is especially important for viscous liquids, impeller trims, different speeds, and pumps near the ends of their published curve.
Check whether the operating point is acceptable, not merely achievable
Finding an intersection is the beginning of pump review, not the end. The selected point must remain inside the pump manufacturer’s documented operating limits and meet the process requirement with sufficient allowance for uncertainty in the system model.
Efficiency and operating range
Best efficiency point (BEP) is the flow at which a pump reaches its maximum published hydraulic efficiency for the stated configuration. Efficiency typically decreases as operation moves away from BEP. The Bell & Gossett pump and system curve manual explains this relationship in a hydronic context, but its example operating ranges should not be transferred to process pumps, slurry pumps, boiler-feed pumps, or other pump families without manufacturer confirmation.
Instead of using a universal distance from BEP, obtain the selected pump’s preferred operating region (POR), allowable operating region (AOR), minimum continuous stable flow, and maximum permitted flow from the manufacturer. These limits can vary with pump design, size, speed, liquid properties, seal arrangement, temperature, and service severity.
Operation away from the intended range can increase internal recirculation, radial hydraulic loading, temperature rise, vibration, seal stress, and bearing load. The severity and allowable limit are pump-specific. The correct decision is therefore to compare each duty case against documented limits, not to assume that any point near the middle of a curve is acceptable.
Power and motor loading
Review input or shaft power at every expected operating point. Pump power does not always peak at the design point; some pump designs draw increasing power as flow increases toward runout. Confirm that the motor, coupling, variable-speed drive, cables, overload settings, and electrical supply are suitable for the highest credible absorbed power.
A motor nameplate alone does not demonstrate adequate margin. Check the actual power curve for the specific impeller and speed, including the maximum-flow case that could occur if a bypass opens, a control valve opens further than expected, or downstream resistance is lower than modeled.
NPSH and suction conditions
Net positive suction head available (NPSHA) must be evaluated separately from the discharge system curve. It depends on absolute suction pressure, liquid vapor pressure at operating temperature, static liquid level, suction-line losses, and flow rate. NPSHR is shown on the pump curve or datasheet for the tested pump configuration.
Compare NPSHA with NPSHR across the relevant flow and temperature range using verified suction conditions. Do not conclude that cavitation will occur simply because the operating point is away from BEP, and do not conclude that it will not occur solely because NPSHA exceeds a catalog value at one nominal flow. The required margin and any suction-energy or reliability limits should follow the pump manufacturer, applicable project requirements, and the service conditions.
Test how controls and equipment changes move the curves
A pump can operate at a different point from its original selection condition even when its speed and impeller remain unchanged. The system curve changes when resistance or static conditions change.
Throttling a discharge valve increases system resistance and usually shifts the operating point toward lower flow and higher pump-developed head. It can be an appropriate control method in some services, but it dissipates energy across the valve and may place the pump closer to minimum-flow limits. Throttling does not reduce static head.
Variable-speed operation changes the pump curve rather than the system curve. The affinity laws can provide preliminary estimates for similar operation with the same pump and liquid, but they are not a complete selection method. Confirm speed limits, motor cooling, minimum continuous flow, NPSH behavior, control stability, and actual manufacturer curves before approving variable-speed operation, particularly near operating limits or with significant viscosity changes.
Parallel pumps require a separate combined-curve analysis. Two identical pumps in parallel do not necessarily deliver exactly twice the flow of one pump. The combined pump curve must be compared with the applicable system curve, and each pump’s individual flow must remain within its acceptable range. A steep system curve, unequal pump characteristics, unstable control logic, or one pump operating near minimum flow can make parallel operation unsuitable.
Review the actual control narrative. Ask what happens when a level-control valve fails open, a standby pump starts, a filter fouls, a recycle line opens, or a heat exchanger is bypassed. These are specific system states, not generic pump scenarios, and each may justify a separate curve review.
Decide whether to change the pump or change the system
Change the pump configuration when the validated system curve shows that the required duty cannot be met within documented pump limits. Possible changes include selecting a different hydraulic size, changing impeller diameter, selecting another speed, using a different number of stages, or choosing a pump family better suited to the liquid and duty range. Each option still requires a review of NPSH, power, mechanical limits, controls, and maintainability.
Change or re-examine the system when the uncertainty is in the system model rather than the pump. Common review points include underestimated static lift, unnecessary restrictions, undersized pipe, restrictive strainers, incorrect control-valve assumptions, excessive equipment pressure drop, and an unclear definition of required delivery pressure. Reducing system resistance can reduce energy demand, but it may also move the operating point toward runout and require a revised pump or control strategy.
Do not use impeller trimming, throttling, speed reduction, or parallel operation as automatic remedies. Each changes the operating point and may create new limits involving minimum flow, motor loading, NPSH, controllability, or process performance.
Before purchase or commissioning, retain a selection record containing the approved pump curve, system-curve calculation, liquid-property basis, duty cases, NPSH calculation, motor-power check, control philosophy, and manufacturer operating limits. During commissioning, use the project test procedure to verify flow, differential pressure or head, power, suction conditions, vibration, leakage, and control response under safe representative conditions. These measurements should be treated as proposed verification requirements unless project-specific test records are available.
The bounded selection rule is simple: accept a centrifugal pump only when the documented pump curve intersects each credible system curve at a point that delivers the required process duty and remains within the manufacturer’s stated hydraulic, mechanical, power, and suction limits. If that cannot be demonstrated, revise the pump, the system assumptions, or both before installation.